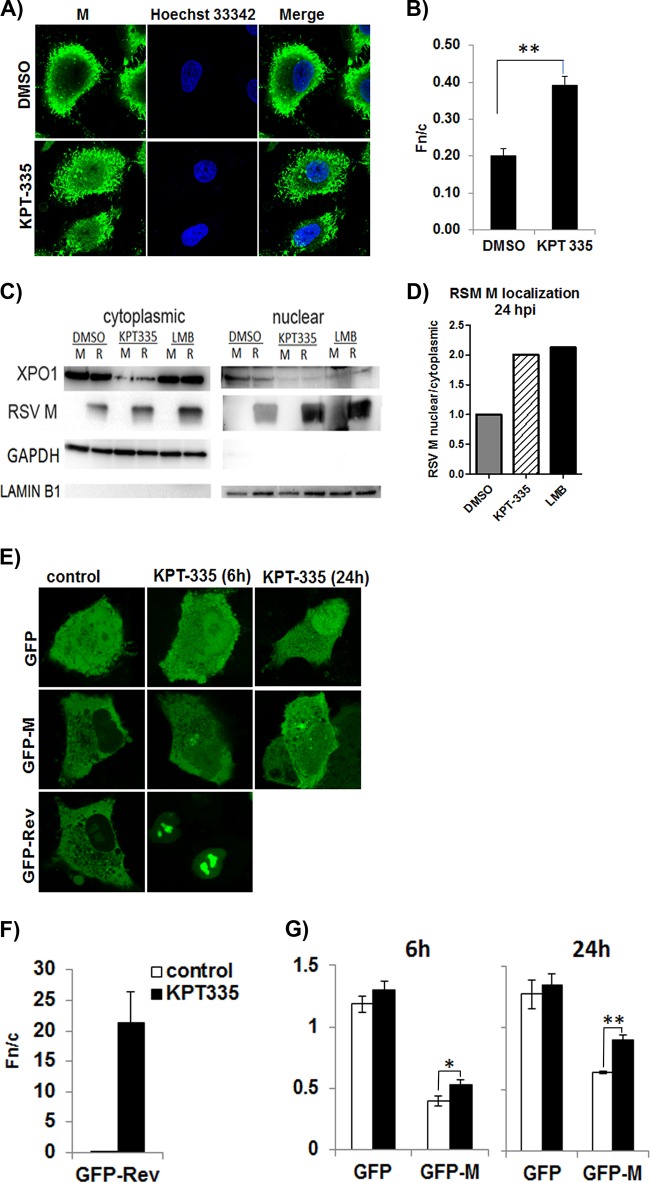
FIG 6.
KPT-335 treatment leads to nuclear accumulation of M protein and XPO1. (A) Monolayers of A549 cells propagated to 80% confluence in 12-well plates containing coverslips were infected with RSV A2 followed by treatment with 1 μM KPT-335 during the early (6 to 18 h p.i.) or late stages (18 to 30 h p.i.) of infection and analyzed at 48 h p.i. by immunofluorescence confocal microscopy for localization of M protein. Cells treated with DMSO were taken as a control. Digital images of 0.5-μm sections were captured with a Nikon Ti-Eclipse confocal system and NIS AR Elements software. (B) Image J was used to determine the nuclear/cytoplasmic ratio (Fn/c) of RSV-M [Fn/c = (Fn − Fb)/(Fc − Fb)], where Fn is the nuclear fluorescence, Fc is the cytoplasmic fluorescence, and Fb is the background or autofluorescence in images such as those shown in panel A. Data shown are means ± standard errors of the means (n ≥ 30) and representative of three independent experiments. Two-way ANOVA followed by Fisher’s least significant difference test was used to determine differences between groups, and statistically significant differences are indicated. **, P < 0.01. (C) RSV A2 infected (R) or mock-infected (M) A549 cells were treated with 1 μM KPT-335, DMSO, or 750 nM LMB from 2 h p.i. Fractions were collected at 24 h p.i., utilizing an NE-PER nuclear and cytoplasmic purification kit. Equivalent protein concentrations of the 24-h p.i. cytoplasmic and nuclear fractions were resolved by SDS-polyacrylamide gel electrophoresis, followed by immunoblotting. Blots were probed for XPO1 and RSV M protein. GAPDH and lamin B1 were used as markers for cytoplasmic and nuclear fractions, respectively. The primary antibodies used are indicated on the left. Images are single blots from one experiment representative of three different experiments; the white line observed in the lamin B1 blot is an artifact produced during exposure and image capture. (D) The relative amount of RSV M protein in the nucleus compared to that in the cytoplasm was estimated by densitometric scanning of the protein bands using ImageJ. Data shown are relative to value for the DMSO-treated samples, taken as 1. (E) A549 cells were transfected using Lipofectamine. After 18 h of incubation, the cells were treated with DMSO or 1 μM KPT-335 for 6 or 24 h. Digital images of 0.5-μm sections were captured with a Nikon Ti-Eclipse confocal system and NIS AR Elements software and representative images are shown. Image J was used to analyze the digital images and determine the Fn/c as described in the legend of Fig. 5. Data are shown in histograms for GFP-Rev after 6 h of treatment with KPT-335 or DMSO (control) (F) and GFP and GFP-M after 6 h and 24 h of treatment with KPT-335 or DMSO (control) (G). Data shown are means ± standard errors of the means (n ≥ 30) and are representative of three independent experiments. Two-way ANOVA followed by Fisher’s least significant difference test was used to determine differences between groups, and statistically significant differences are indicated. *, P < 0.05; **, P < 0.001.

