. 2019 Jan 3;33(1):99–108. doi: 10.21873/invivo.11445

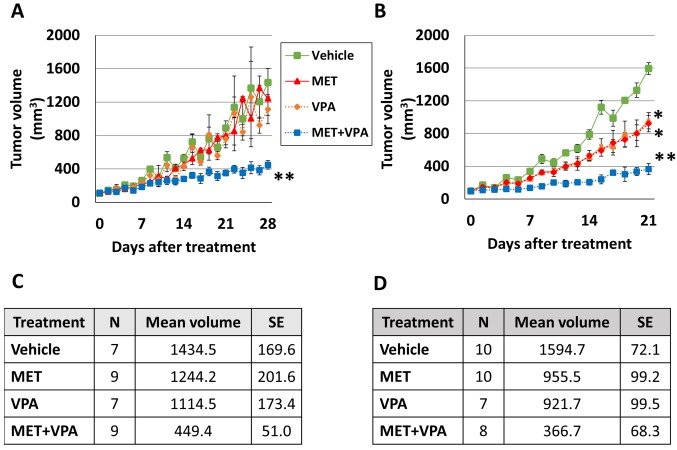
Figure 3. Tumor growth in response to metformin (MET) and/or valproic acid (VPA) treatment. Nude mice at 6 weeks of age were inoculated subcutaneously with PC-3 (A) or LNCaP (B) cells. The xenograft tumors were allowed to grow to 100 mm3 before treating the mice with either vehicle control, 200 μg/ml MET alone, 0.4% (w/v) VPA alone, or 200 μg/ml MET+0.4% (w/v) VPA. The sample size (N), mean tumor volume (mm3) and standard error (SE) of PC-3 xenografts on day 28 of treatment and LNCaP xenografts on day 21 of treatment are presented in tables C and D, respectively. *p<0.05 compared to the vehicle, MET alone, and VPA alone. **p< 0.005 compared to the vehicle, MET alone, VPA alone, and MET+VPA (7≤n≤10).

Figure 3