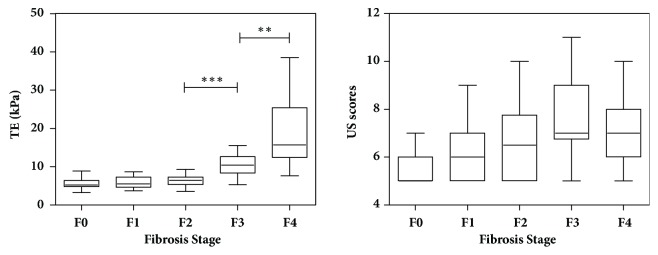
Figure 3.
Box and whisker plots of TE and US scores at each fibrosis stage. The central box represents values from lower to upper quartile (25th -75th percentile). The line through each box represents the median. The mean liver stiffness measured with TE increased significantly from F2 to F4 (F2 vs F3, P<0.001; F3 vs F4, P=0.002). ∗∗, P <0.01. ∗∗∗, P <0.001.

