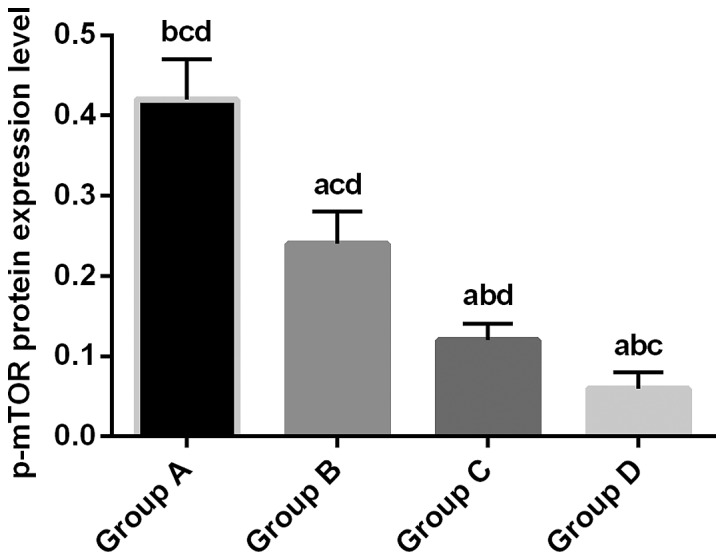
Figure 3.

Detection of p-mTOR protein expression by western blot analysis. Normalized expression level of p-mTOR protein in the experimental group B, C and D was 0.24±0.04, 0.12±0.02 and 0.06±0.02, respectively, which was significantly lower than that in control group A (0.42±0.05; P<0.05). Relative expression level of p-mTOR protein in group C and D was significantly lower than that in group B (P<0.01). Relative expression level of JNK3 protein in group D was significantly lower than that in group C (P<0.01). aP<0.01, compared with group A. bP<0.01, compared with group B. cP<0.01, compared with group C. dP<0.01, compared with group D. mTOR, rapamycin target protein.
