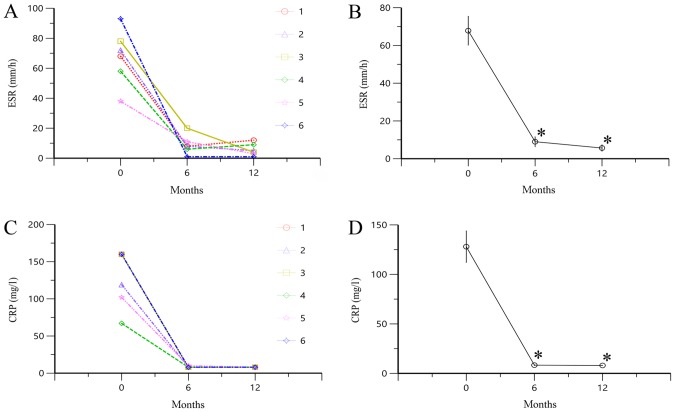
Figure 1.
Alterations in ESR and CRP level following treatment with TAC. (A) ESR of each patient. (B) Mean ± SE values of ESR. (C) CRP levels of each patient. (D) Mean ± SE values of CRP levels. *P<0.05 vs.0 months. ESR, erythrocyte sedimentation rate; CRP, C reactive protein; TAC, tacrolimus; 0 months, data obtained prior to treatment with TAC; 6 months, data obtained at 6 months of treatment with TAC; 12 months, data obtained at 12 months of treatment with TAC.

