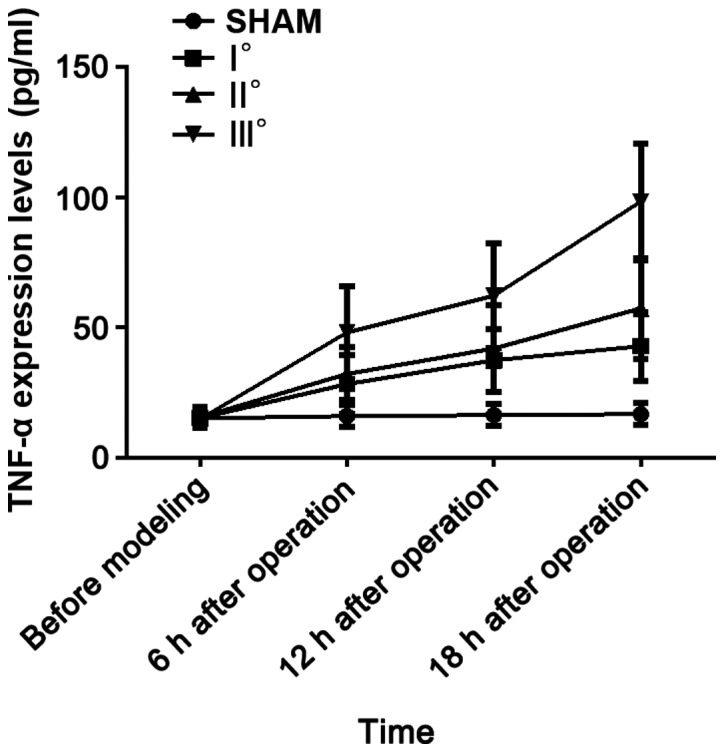
Figure 5.

ELISA detection results of TNF-α. Results of analysis of variance manifest that the TNF-α expression levels in the 4 groups of rats at 6, 12 and 18 h after operation are different (P<0.05). In I°, II° and III° burn groups, the TNF-α expression levels are increased at 6, 12 and 18 h after operation compared with those before modeling (P<0.05), and they are higher at 12 and 18 h after operation than those at 6 h after operation (P<0.05) and also higher at 18 h after operation than those at 12 h after operation (P<0.05). At the same time point, the TNF-α expression levels in I°, II° and III° burn groups are higher than that in SHAM group (P<0.05), and they are higher at each time point in II° and III° burn groups than that in I° burn group (P<0.05) and also higher at each time point in III° burn group than that in II° burn group (P<0.05).
