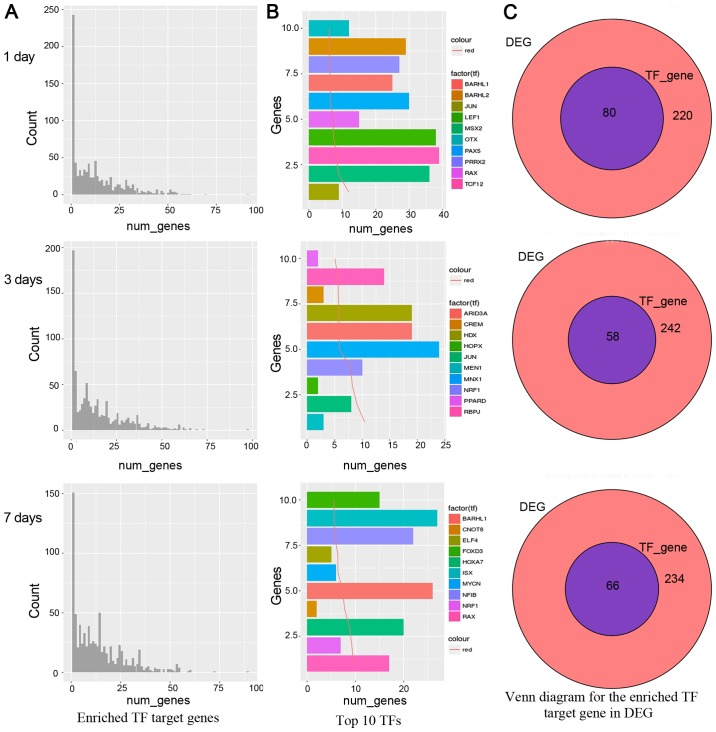
Figure 2.
Enrichment of gene quantity distribution. (A) Enriched TF target genes at day 1, 3 and 7, respectively. A small number of transcription factors are enriched in the number of target genes, while most of the transcription factors are not abundant in abundance. Thus, those transcription factors rich in genes may be the focus of our attention. (B) Enriched the top 10 TFs, which are located on the left of panel A, are the focus of research. (C) Venn diagram for the enriched TF target gene in DEG at day 1, 3 and 7, respectively.

