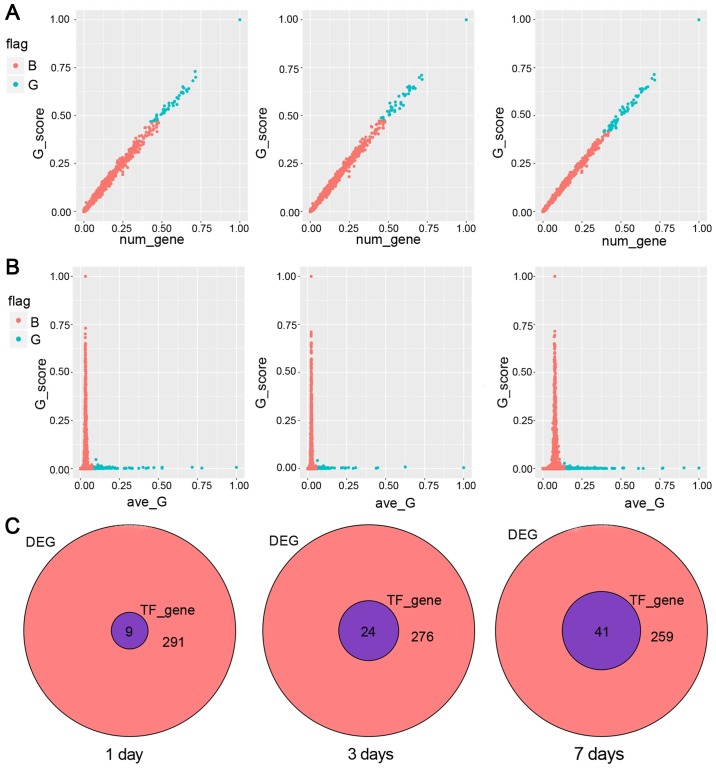
Figure 3.
The relationship between G value and the affected genes at day 1, 3 and 7, respectively. (A) The relationship between G score and genes number. The red points indicate the rank value is <0.5, while the blue points indicate the rank value is >0.5. (B) The relationship between G score and average G. The red points indicate the average of transcription factors below the overall mean plus standard deviation. The blue points indicate the average of transcription factors above the overall mean plus standard deviation. We should focus on the middle area. (C) Target genes of the TF with top G in the expression profile in DEG.

