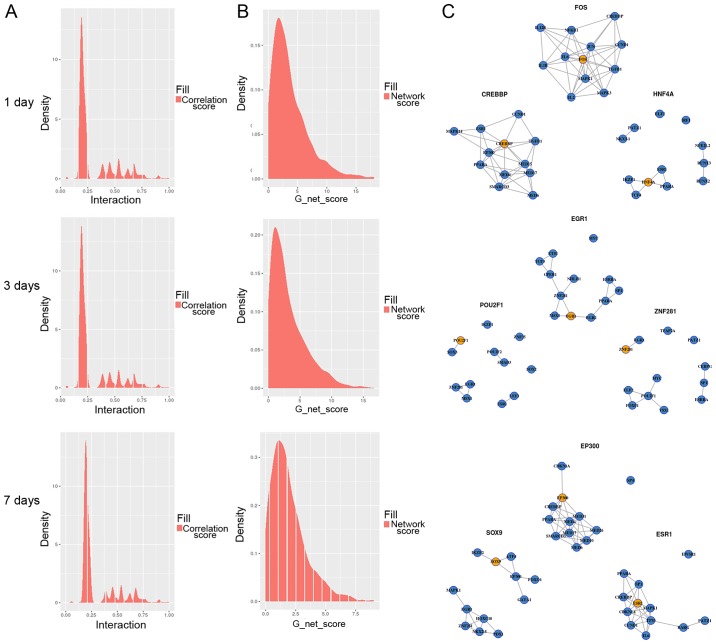
Figure 5.
Distribution of PPI final network edge value at day 1, 3 and 7, respectively. (A) G values were not evenly distributed, and most of the transcription factors have a low G-score. (B) The density of edge values mostly converges in the middle. Therefore, attention should be paid to those having a higher value, that is, the figure on the right side of the collection. (C) Network diagram of the maximum network access G value. The orange dots indicate the transcription factors and the blue dots are the regulatory genes.

