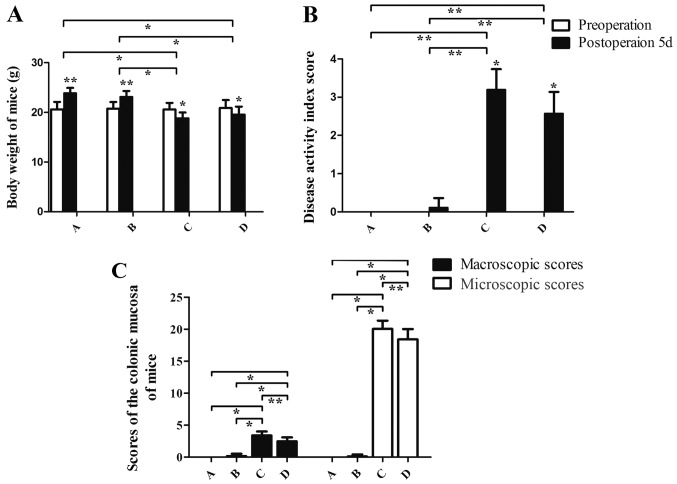
Figure 1.
Body weight, disease activity index score and mucosa macroscopic and microscopic scores of mice. (A) The body weight of mice. (B) The disease activity index score score in group A, B, C and D. TNBS-ethanol solution was only administered in groups C and D (Establishment of the animal model of UC with TNBS-ethanol solution). (C) The macroscopic and microscopic scores of the colonic mucosa of mice. A (control group), B (stress group), C (UC and stress group), D (UC model alone). *P,0.05, **P<0.01. UC, ulcerative colitis.

