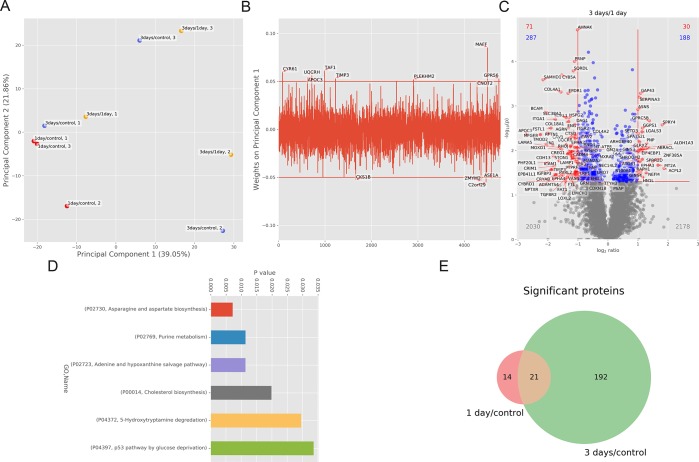
Figure 5.
(A) PCA analysis of quantitative proteome data with sample annotations: Colors distinguish early treated (red) from late-treated samples (blue). In yellow, the third experimental group is indicated, which consists of the ratio between 3 days and 1 day treatment. For each sample, the biological replicate number is reported. (B) Weight of principal component 1 identifies key proteins, which affect the separation between the early and late-treated samples. (C) Volcano plot as visualization of one-sample t-test of protein expression levels at 3 days versus control. Statistically significant values with p-value < 0.05 and fold change ≥ 2 are labeled in red. Values with p-value < 0.05 and fold change ≤ 2 are labeled in blue. All the values with p-value > 0.05 are labeled in gray. (D) Bar plot of GO enrichment analysis of significant up-regulated pathways at 3 days treatment. (E) Venn diagram of significantly regulated proteins at 1 day and 3 days of treatment versus control.

