
Figure 6.
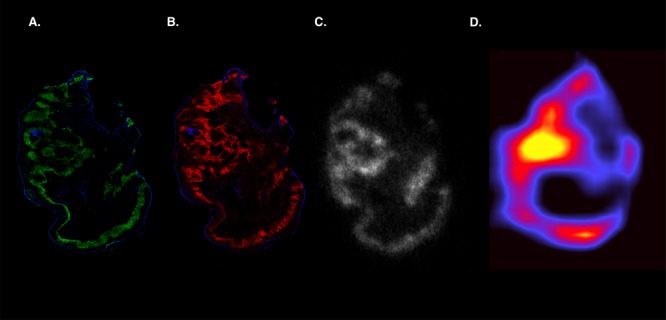
Visualization of tumor heterogeneity. Example SCCNij202 xenograft imaged after immunohistochemical staining (A,B; green = pimonidazol, red = CAIX, blue = vessels), autoradiography (C), and microSPECT (D).
Official websites use .gov
A
.gov website belongs to an official
government organization in the United States.
Secure .gov websites use HTTPS
A lock (
) or https:// means you've safely
connected to the .gov website. Share sensitive
information only on official, secure websites.
Visualization of tumor heterogeneity. Example SCCNij202 xenograft imaged after immunohistochemical staining (A,B; green = pimonidazol, red = CAIX, blue = vessels), autoradiography (C), and microSPECT (D).