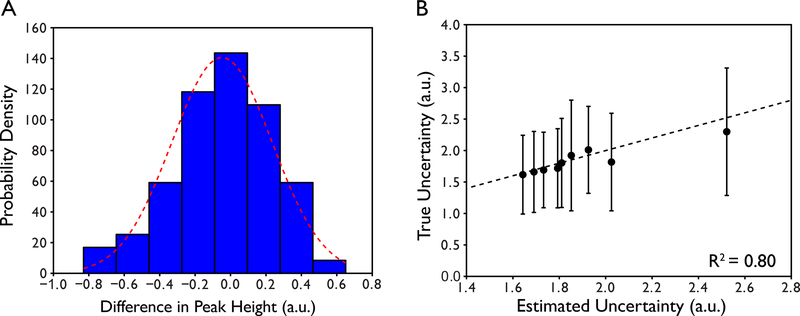
Figure 3.
Determination of the uncertainty in peak height. (A) Histogram of the differences in normalized peak heights between reference and duplicate spectra of a single plane of a 15N R1 relaxation series for the protein ubiquitin. The red dotted line is the best fit to a normalized Gaussian probability density function where the integrated area of the Gaussian is equal to 1. Note that the distribution is described well by a Gaussian function suggesting that uncertainties in peak height have a random origin. (B) Comparison of true uncertainty in peak height derived from 5 complete 15N R1 relaxation series and estimated uncertainty in peak height from replication of a subset of the data (see text).

