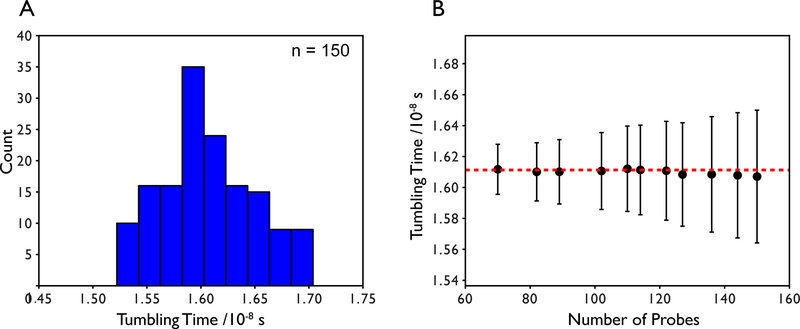
Figure 5.
(A) Distribution of local tumbling times derived from least squares fitting using the full 15N spectral densities for T1 and T2 and TROSY 15N R1 and R1ρ relaxation data collected on the 42 kDa maltose binding protein. Data exceeding 1.5 standard deviations from the mean have been filtered as well as any Rex outliers. (B) The average tumbling time and standard deviation as a function of the number of probes used in the calculation. The number of probes used in the calculation does not change the mean tumbling time by more than 0.4% indicating a well-determined global tumbling time. The largest standard deviation is approximately 2.7% of the mean.

