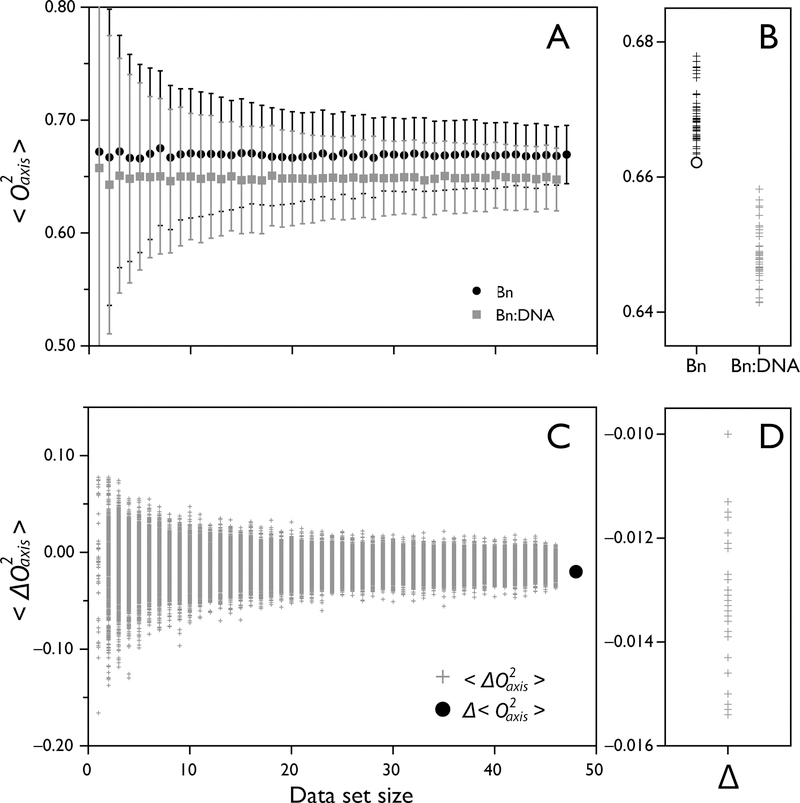
Figure 9.

Sampling statistics of measured O2axis of barnase binding DNA. The O2axis values of free barnase and barnase bound to DNA are analyzed to determine the robustness of Δ<O2axis> and <ΔO2axis> values. (A) Bootstrap analysis of <O2axis> of barnase (black circles) and barnase-DNA (grey squares) as a function of dataset size, showing a narrow distribution of possible <O2axis> of 0.669 ± 0.026 and 0.647 ± 0.028, respectively. (B) Jackknife analysis of <O2axis> identifies the extra data point not measured in the barnase-DNA dataset by removing it and resulting in one of the extreme <O2axis> values using n-1 datapoints (open circle). (C) Bootstrap analysis of <ΔO2axis> of barnase binding DNA, yielding the value −0.013 ± 0.008. The value is well-determined even when only 20 datapoints are used. The global difference Δ<O2axis> is shown as a black circle. (D) Jackknife analysis of site-specific <ΔO2axis> shows a narrow distribution of possible values.
