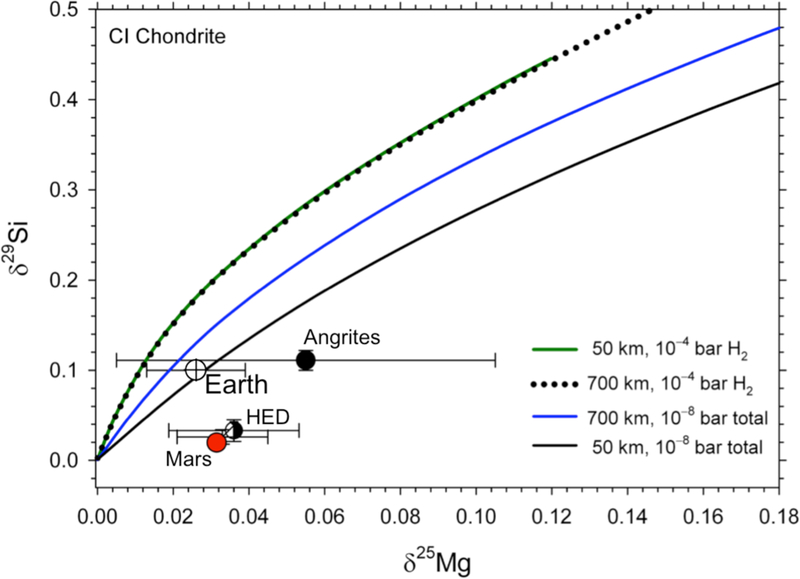
Figure 11.
Model curves depicting the Mg and Si isotopic compositions of planetesimals of CI composition subjected to evaporation. Each point on the curves represents a particular time during the evaporation process. Four models representing two different planetesimal radii and two different pressure environments are shown. The 700 km model at 10−8 bar represents evaporation that forms a steady-state rock vapor for the ½ MPluto body absent protostellar nebular gas. The 700 km and 50 km bodies at 10−4 bar of H2 represent evaporation in the presence of protostellar gas. Estimates for the isotopic compositions of silicate Earth, Mars, the HED parent body (Vesta), and the angrite parent body are shown for reference (same data sources as for Figure 1).

