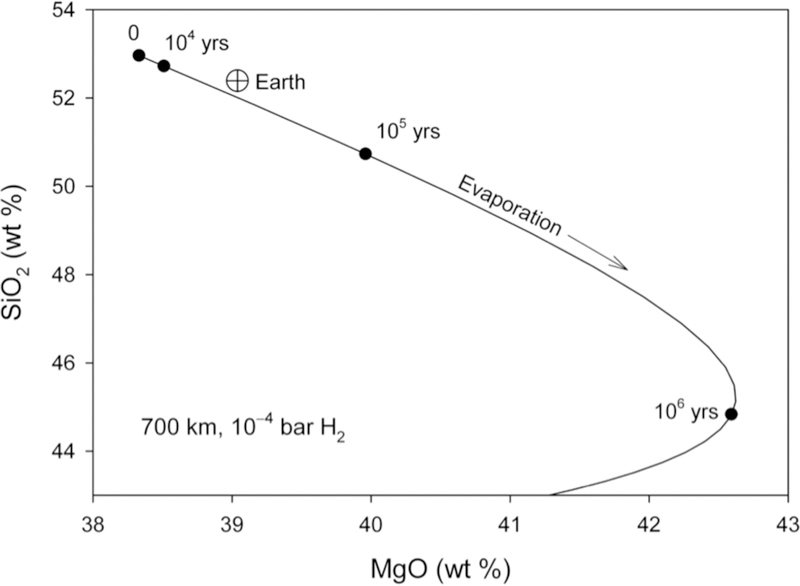
Figure 13.
Plot of weight per cent SiO2 vs MgO for the ½ MPluto evaporation model based on a CI starting composition projected into the CMAS chemical system. Earth is shown for comparison (circle with cross). Black dots mark the time evolution, suggesting a cessation of evaporation between ~ 104 and 105 years.

