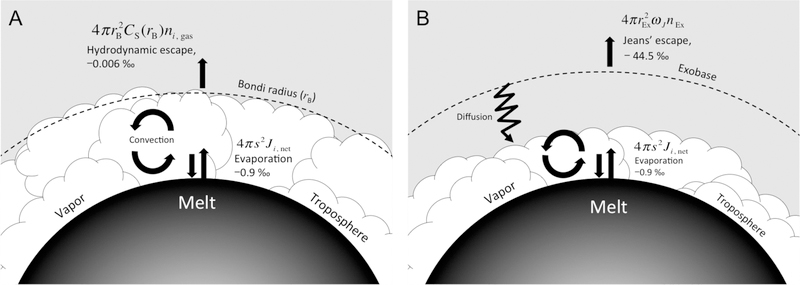
Figure 15.
Schematic illustration of the balance between evaporative losses of Mg gas from a molten silicate surface and concurrent losses of Mg from the vapor by either hydrodynamic escape (A) or Jeans’ escape (B). The 25Mg/24Mg isotopic fractionation of the gas emanating from the melt (−0.9 ‰ relative to the melt) and that of the gas leaving the atmosphere (−0.006 and −44.5 ‰ for hydrodynamic escape and Jeans’ escape relative to the gas, respectively) are shown in both cases. The positions of the Bondi radius and the exobase relative to the mixed layer (troposphere) are indicated for the two different scenarios by the dashed curves. Mixing by convection is indicated by the circular arrows and possible mixing by diffusion is shown by the zigzag arrow.

