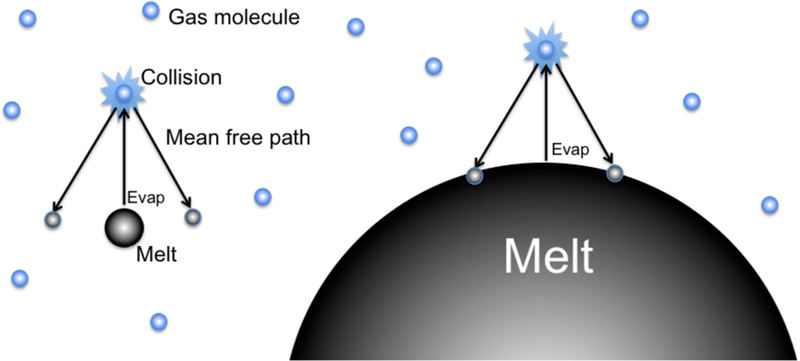
Figure 3.
Schematic illustration of the effect of droplet size on return flux of gas. Evaporation is depicted by the upward vertical arrows. Evaporated molecules (small black spheres) collide with surrounding gas molecules (blue spheres). Droplets that are small in diameter compared with the mean free path (left side) capture less of the return flux than droplets that are large relative to the mean free path (right side).

