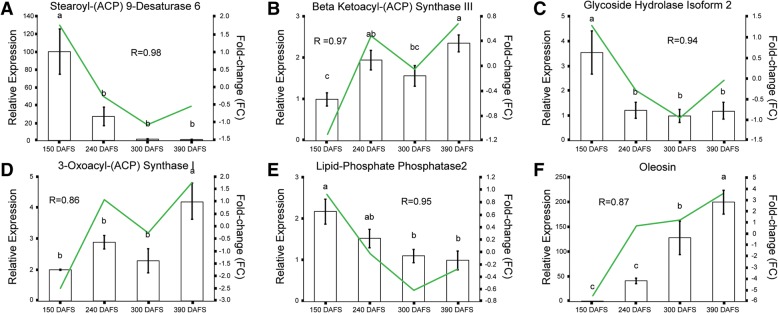
Fig. 4.
Correlation between qRT-PCR and in silico gene expression. The figure shows six transcripts analyzed this study: (a) Stearoyl-(ACP) 9-desaturase 6, (b) Beta-ketoacyl-ACP Synthase III, (c) Glycoside Hydrolase Isoform 2, (d) 3-Oxoacyl-(ACP) Synthase I, (e) Lipid Phosphate Phosphatase 2 and (f) Oleosin. The left Y axis displays the normalized relative expression levels to PamActin gene, while the right Y axis shows the FC values from the differential expression analysis, X axis indicates the development stage. R indicates the spearman correlation coefficient between in vitro and in silico expression values

