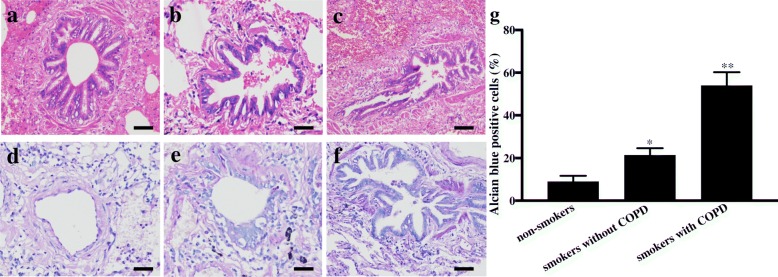
Fig. 1.
Inflammation response and mucus secretion in the lung specimens. Representative photomicrographs of HE staining in airways from non-smokers without COPD (a), smokers without COPD (b) and smokers with COPD (c). Representative photomicrographs of AB-PAS staining from non-smokers without COPD (d), smokers without COPD (e) and smokers with COPD (f). Scale bars = 50 μm. Percentage of PAS-positive cells in all the airways in the three groups (g). *p < 0.05, compared with the non-smokers group, **p < 0.05, compared with the smokers without COPD group

