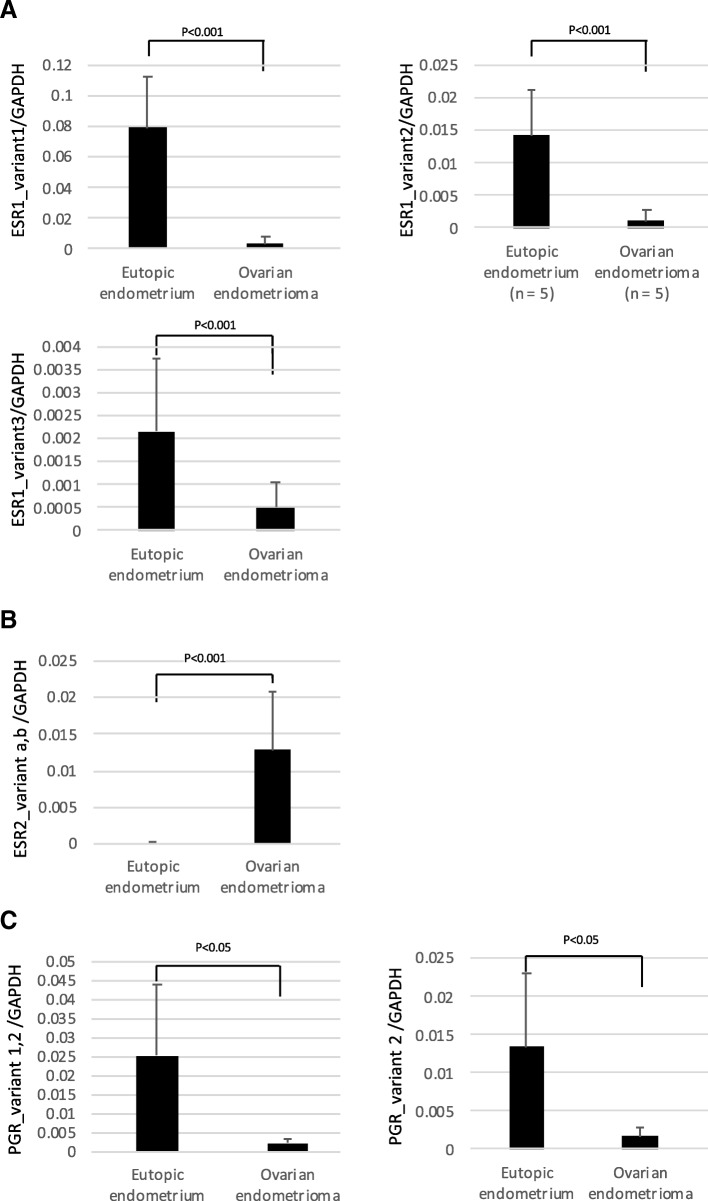
Fig. 2.
mRNA expression statuses of ESR1, ESR2 and PGR variants in EE and OE. ESR1 (variant 1, 2, and 3) (a) ESR2 (variant a and b) (b) and PGR (variant 1 and 2) (c) were analyzed by qRT-PCR. GAPDH was used as an internal control. The amount of mRNA of each variant was normalized to that of the internal control (GADPH). Data were expressed as a ratio of mRNA of each variant to GADPH. Each bar represents the mean +/− SEM.* p < 0.05

