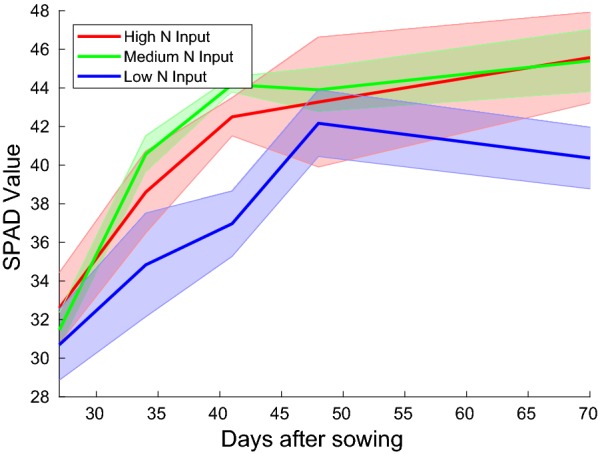
Fig. 7.

Means and standard deviations of SPAD measurement values obtained over three replications of each of the three different Nitrogen treatment regimens. One can see that the plant N availability which correlates strongly with the SPAD values is lower in the deficient (Low N input) case, however, similar for the medium and high N input levels. This indicates that the plants’ Nitrogen requirement in these two cases is satisfied, hence there is little need for the additional fertilizer present in the high N treatment
