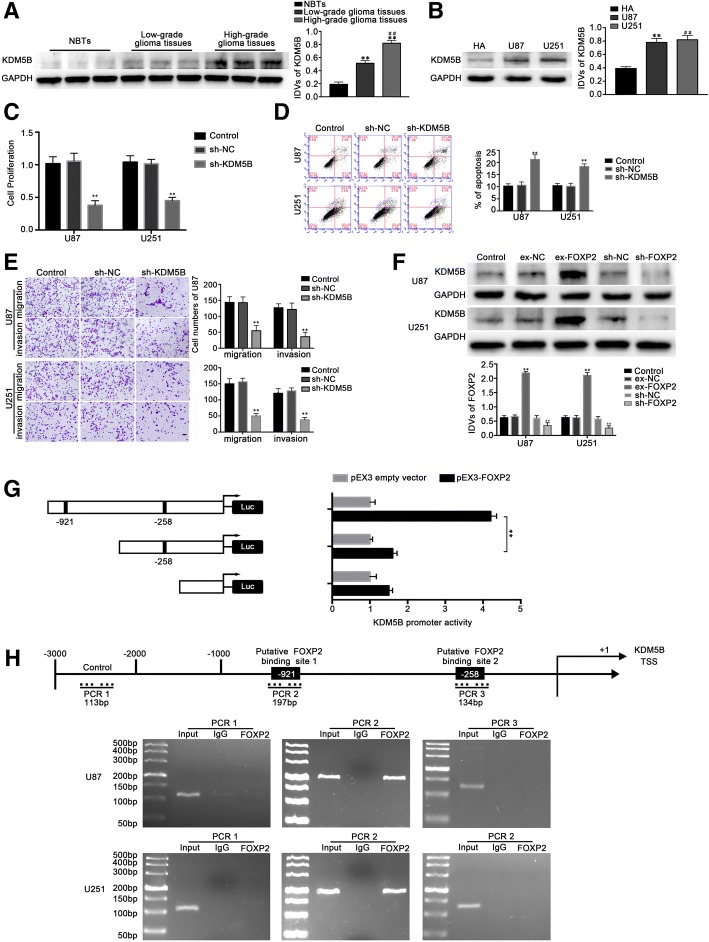
Fig. 4.
KDM5B functioned as an oncogene in both glioma tissues and cells, FOXP2 mediated malignant progression of glioma cells by targeting transcription start site of KDM5B. a KDM5B protein expression in glioma tissues of different grades and normal brain tissues (NBTs) with GAPDH as an endogenous control. Data were presented as the mean ± SD (n = 10, each group). **P < 0.01 vs. NBTs group. ##P < 0.01 vs. low grade group. b Western blot analysis of KDM5B expression in U87 and U251 cells, with GAPDH as an endogenous control. **P < 0.01 vs. HA group. c CCK-8 assay was performed to explore the proliferation effect of FOXP2 on U87 and U251 cells. d Incidence of apoptotic cells was studied by flow cytometry. e Effects of FOXP2 expression changes on cell migration and invasion of U87 and U251 cells. Scale bars represented 20 μm. For C, D and E, data were presented as the mean ± SD (n = 5, each group). **P < 0.01 vs. sh-NC group. f Western blot analysis revealed the negative correlation between FOXP2 and KDM5B expression in U87 and U251 cells. Data are presented as the mean ± SD (n = 5, each group). **P < 0.01 vs. ex-NC group, ##P < 0.01 vs. sh-NC group. g Schematic depiction of the KDM5B reporter constructs and their luciferase activities. The Y-bar showed the position of the deletions on the DNA fragments. X-bar showed the constructed plasmid activity after normalization with the co-transfected reference vector (pRL-TK), and relative to the activity of pEX3 empty vector, which the activity was set to 1. Data represent means ± SD (n = 5, each). h Schematic representation of the KDM5B promoter region 3000 bp upstream of the transcription start site (TSS) which designated as + 1. ChIP PCR products for putative binding sites and an upstream region not expected to associate with FOXP2 were depicted with bold lines. Immunoprecipitated DNA was amplified by PCR. Images are representative of independent experiments (n = 4)

