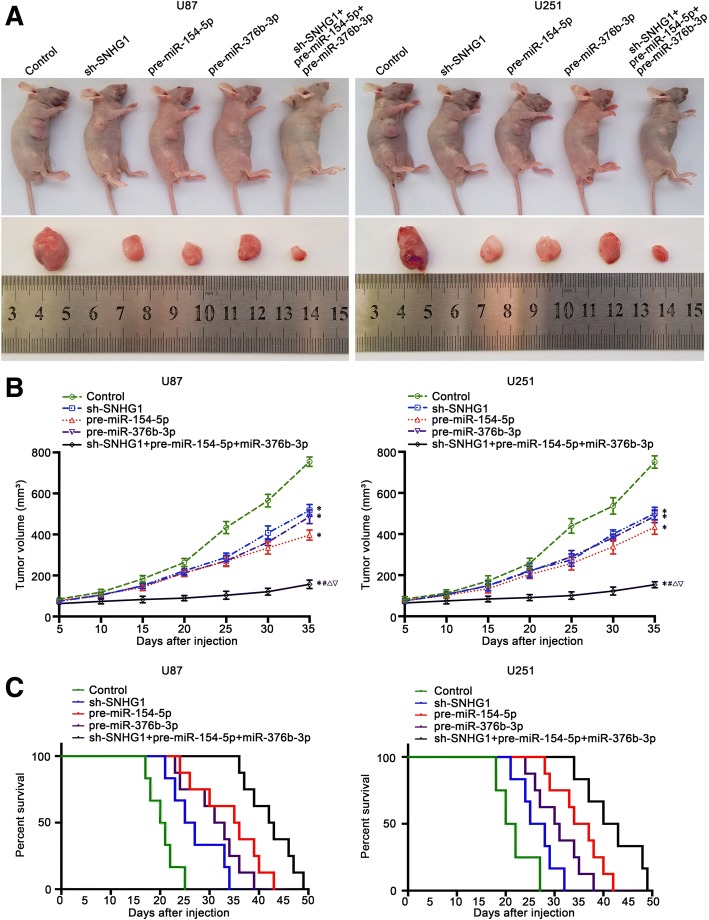
Fig. 7.
Tumor xenografts study of tumor growth and survival rates in nude mice. a The nude mice carrying tumors of respective groups were shown. Sample tumors from respective group were shown. Tumor growth curves of five groups in nude mice (n = 8, each group). b Tumor volume was calculated every five days after injection. Tumors were harvested on day 35 and weighed. c The survival curves of nude mice injected into the right striatum (n = 8, each group). *P < 0.05, #P < 0.01, ∆P < 0.05, ∇P < 0.05

