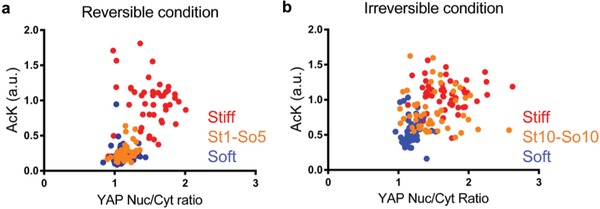
Figure 6.

Significant positive correlation between YAP Nuc/Cyt ratio and histone acetylation for hMSCs grown on hydrogels in both reversible and irreversible conditions. a) Single cell scatter plot of histone acetylation intensity as a function of YAP Nuc/Cyt ratio for hMSCs in stiff (red), soft (blue), or St1‐So5 (orange) conditions. The population of hMSCs cultured in the St1‐So5 condition (orange) cluster with the population of hMSCs cultured in the soft control condition (blue). b) Single cell scatter plot of histone acetylation intensity as a function of YAP Nuc/Cyt ratio for hMSCs in stiff (red), soft (blue), or St10‐So10 (orange) conditions. The population of hMSCs cultured in the St10‐So10 condition cluster more with the population of hMSCs cultured in the stiff control condition (red).
