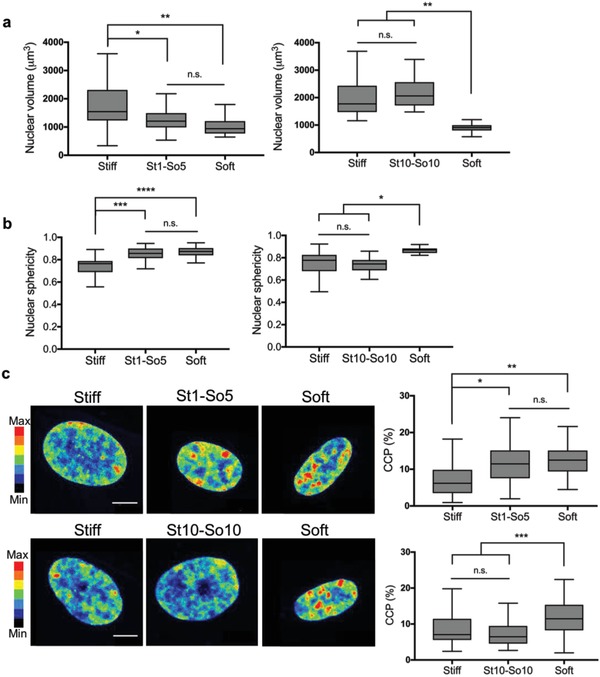
Figure 7.

Influence of reversible and irreversible mechanical dosing on nuclear morphology and chromatin condensation. a) Nuclear volume was quantified based on nuclear immunostaining with DAPI for reversible or irreversible condition. Softening after 1 d (St1‐So5 condition) allowed nuclear volume to revert to basal levels for the soft condition. Softening after 10 d (St10‐So10 condition) resulted in nuclear volume significantly above basal levels for the soft condition but comparable to levels of the stiff condition. n.s.: p > 0.05, *: p < 0.05, **: p < 0.01 based on one‐way ANOVA followed by Tukey's post hoc test. n = 3 with more than 20 hMSCs analyzed per sample. Values are shown as median ± 1.5 IQR. b) Nuclear sphericity was quantified based on nuclear immunostaining with DAPI for reversible or irreversible condition. Softening after 1 d (St‐So5 condition) allowed nuclear sphericity to revert to basal levels for the soft condition. Softening after 10 d (St10‐So10 condition) resulted in nuclear sphericity comparable to the stiff condition but significantly above basal levels for the soft condition. n.s.: p > 0.05, *: p < 0.05, ***: p < 0.001 based on one‐way ANOVA followed by Tukey's post hoc test. n = 3 with more than 20 hMSCs analyzed per sample. Values are shown as median ± 1.5 IQR. c) Chromatin condensation was visualized by creating a heatmap of the DAPI intensity and calculating the chromatin condensation parameter (CCP) using a Matlab script. Nuclei in the St1‐So5 condition showed high intensity clusters within the nucleus comparable to the nuclei on the soft condition. CCP values for this condition reverted to basal levels for the soft condition. Nuclei in the St10‐So10 condition showed less high intensity clusters comparable to nuclei on the stiff condition. CCP values for this condition remained above basal levels for the soft condition but comparable to levels of the stiff condition. n.s.: p > 0.05, *: p < 0.05, ***: p < 0.001 based on one‐way ANOVA followed by Tukey's post hoc test. n = 3 with more than 20 hMSCs analyzed per sample. Values are shown as median ± 1.5 IQR. Scale bar = 10 µm.
