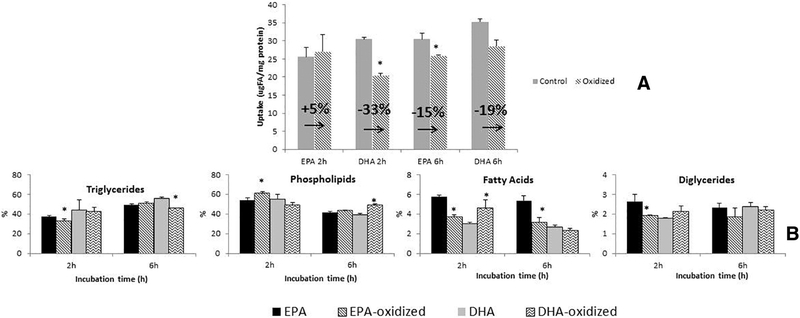
Fig. 3.
Net uptake (A) and lipid metabolism (B) of Caco-2 cells incubated during 2 and 6 h with control (nonoxidized) and oxidized radiolabeled EPA and DHA. Oxidation achieved incubating the taurocholate/PUFAs medium under gastric conditions (37°C, 2.5 h and pH 1.5). The uptake is expressed as μg FA/mg of protein, and variation of uptake between control/ oxidized PUFAs is expresed as percentage. Results for lipid metabolism are expressed as percentage of each lipid class by total lipids. Standard deviations (n=3) are shown on the figure, and significant differences between oxidized and nonoxidized PUFAs at P<.05 (A) or P<.001 (B) are expressed as *.

