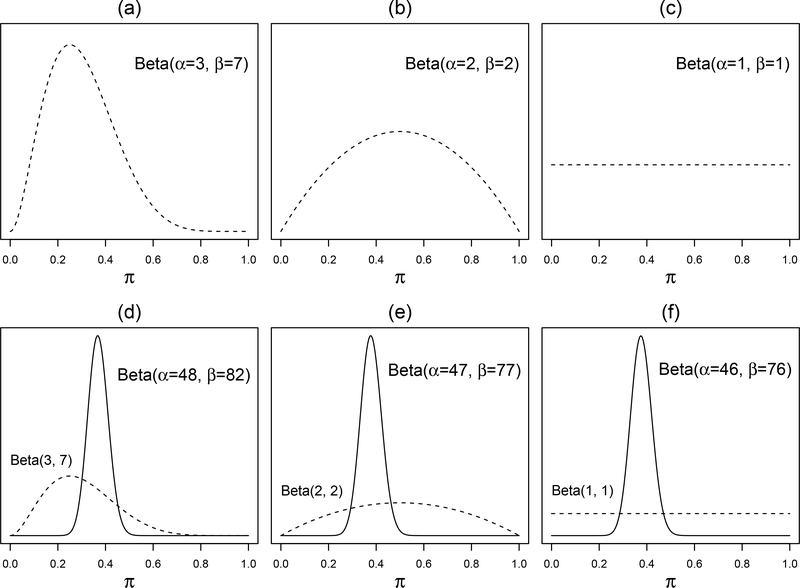
Figure 1.
Examples of Beta distributions representing varying degrees of evidence strength over all possible values of the proportion. Subplot (a) shows a variable in which 3 of the 10 persons in the first latent group endorse the symptom; thus the peak is at around 30%. There is uncertainty because an observation of 3 out of 10 can still arise from an underlying probability of 50% (although much less likely). Subplot (b) is flatter, indicating a weaker evidence from 4 persons. Subplot (c) shows a flat Beta prior representing complete uncertainty about the proportion. Subplots (d) to (f) show how the priors above converge to posteriors of a similar shape if combined with a new, larger sample of 120 patients with 45 endorsing a symptom.

