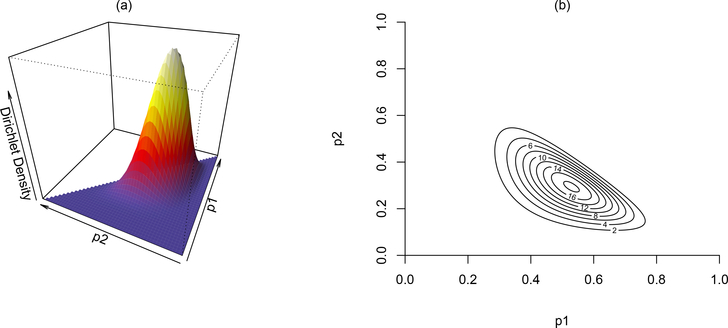
Figure 2.
A Dirichlet distribution for a multinomial variable with three categories. Subplot (a) shows the Dirichlet density in 3-dimensions, where the overall shape of the distribution is defined by the prior sample size u = [10, 6, 4], over the first and second percentages, labeled as p1 and p2, respectively. In (b), the contour of the 3-dimensional surface is plotted to visualize the mode of the distribution near (0.5, 0.3, 0.2).

