Fig. 6.

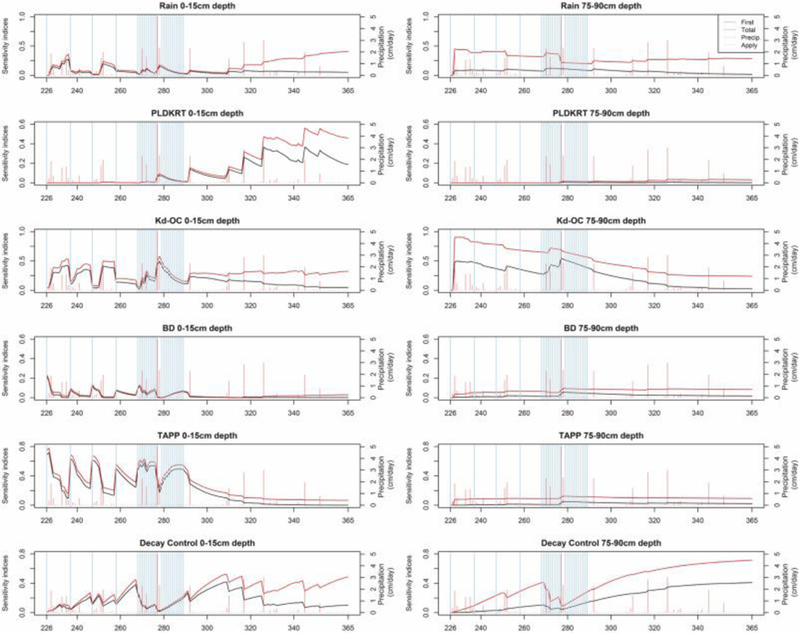
Time series plots of the first (black) and total order (red) sensitivity indices for the top six influential parameters at two soil compartments (0–15 cm and 75–90 cm).

Time series plots of the first (black) and total order (red) sensitivity indices for the top six influential parameters at two soil compartments (0–15 cm and 75–90 cm).