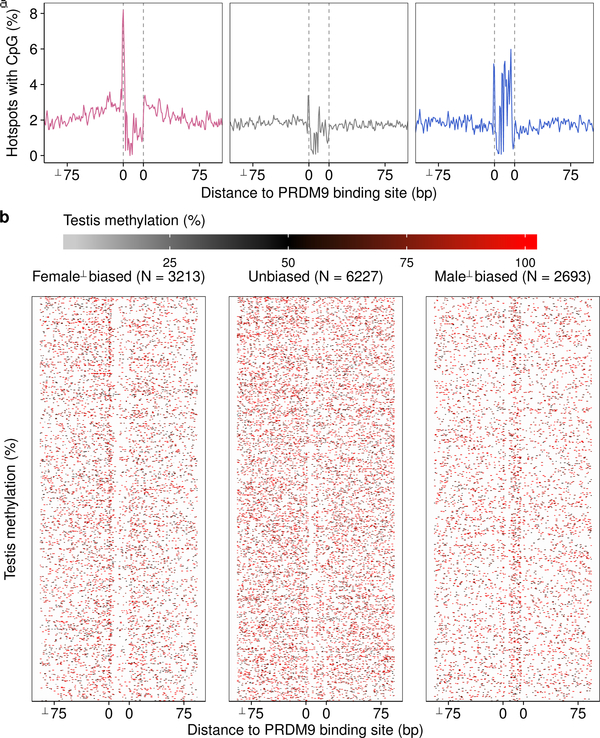
Extended Data Fig 7: Differing patterns of DNA methylation at sex-biased hotspots.
a, Mean DNA methylation40 at the putative PrBS (grey bar) of female-biased (pink), unbiased (grey) and male-biased (blue) hotspots. Note that this panel is also shown in Fig 4a. b, Heatmap rows depict methylation at individual hotspots. Note that the density of methylation appears higher at unbiased hotspots because rows are more densely spaced.

