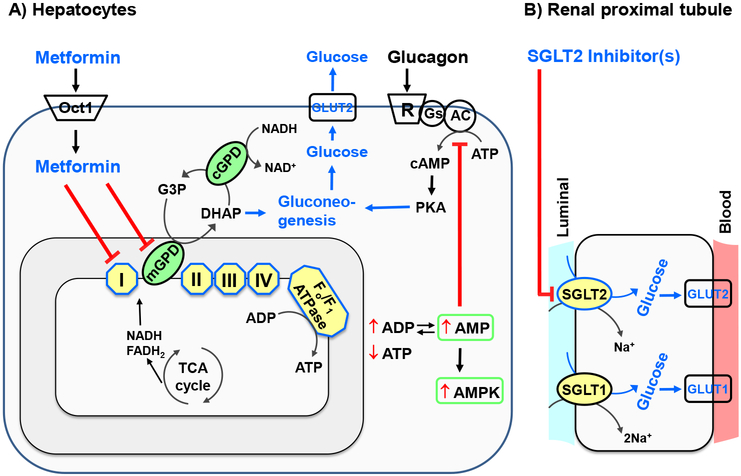
Fig. 1.
Molecular targets of metformin and SGLT2 inhibitors. A) After its uptake through Oct1 in hepatocytes, metformin inhibits gluconeogenesis (and thereby glucose output) through inhibition of complex I or mGPD, a decrease in ATP/ADP ratio, inhibition of AC by AMP, and activation of AMPK. B) SGLT2 inhibitors inhibit SGLT2-mediated reabsorption of glucose in the S1 segment of renal proximal tubule. I, II, III, IV, complexes I through IV; ADP, adenosine diphosphate; AMP, adenosine monophosphate; AMPK, AMP-activated protein kinase; ATP, adenosine triphosphate; cAMP, cyclic AMP; cGPD, cytosolic glycerophosphate dehydrogenase; DHAP, dihydroxyacetone phosphate; GLUT1, glucose transporter-1; GLUT2, glucose transporter-2; G3P, glycerol-3-phosphate; mGPD, mitochondrial glycerophosphate dehydrogenase; Oct1, organic cation transporter-1; PKA, protein kinase A; SGLT1, sodium glucose co-transporter-1; SGLT2, sodium glucose co-transporter-2; ⊥, inhibition; ↑, increase; ↓ decrease.

