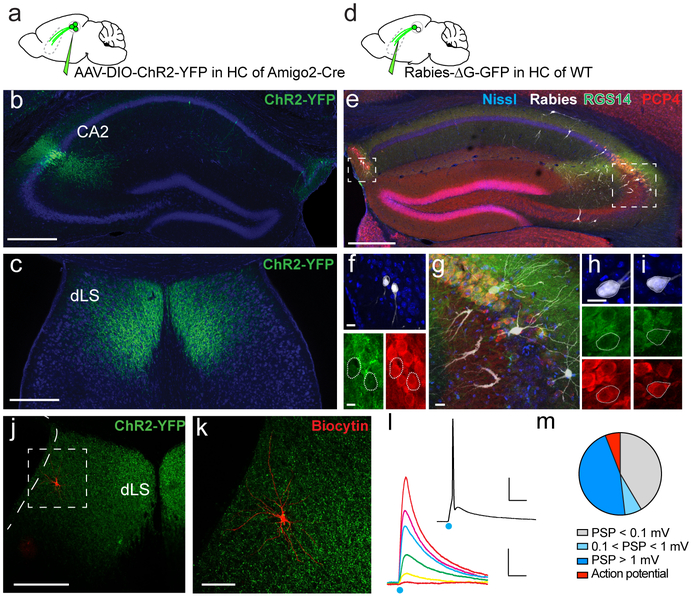
Figure 1: CA2 projections to the lateral septum.
a. Anterograde tracing from dCA2 PNs. b. Coronal hippocampal section from an Amigo2-Cre mouse injected in dCA2 with rAAV5-EF1a-DIO-hChR2(E123T/T159C)-eYFP. c. Coronal section showing dCA2 projections in dLS. d. Monosynaptic retrograde tracing from dLS. e. Coronal hippocampal section of a WT mouse injected in dLS with a G-deleted rabies virus expressing GFP (white), with immunostaining for CA2 markers RGS14 (green) and PCP4 (red). f-i. High-magnifications views of genetically-defined CA2 PNs in Fasciola Cinerea (f) and CA2 proper (h-i) labelled by rabies virus (white) and co-labelled for RGS14 and PCP4. j-k. Coronal LS section of an Amigo2-Cre mouse injected in CA2 with rAAV5-EF1a-DIO-hChR2(E123T/T159C)-eYFP. A dLS cell filled with biocytin (red) during whole-cell recordings is shown at low (j) and high (k) magnification. l. dLS cell current-clamp responses to photoactivation of ChR2-expressing dCA2 inputs with increasing light intensity. Inset shows spiking response of same dLS cell to light. m. Pie-chart of the maximal dLS light-induced PSP amplitude frequency distribution, including fraction of cells where an action potential was elicited (135 dLS neurons). 3 mice injected per experiments in a and d. All mice presented similar staining patterns. Scale bars: b, c, e, j: 400 μm; f, g, h and i: 20 μm; k: 100 μm; l: bottom, 5 mV/20 ms, top, 20 mV/20 ms.

