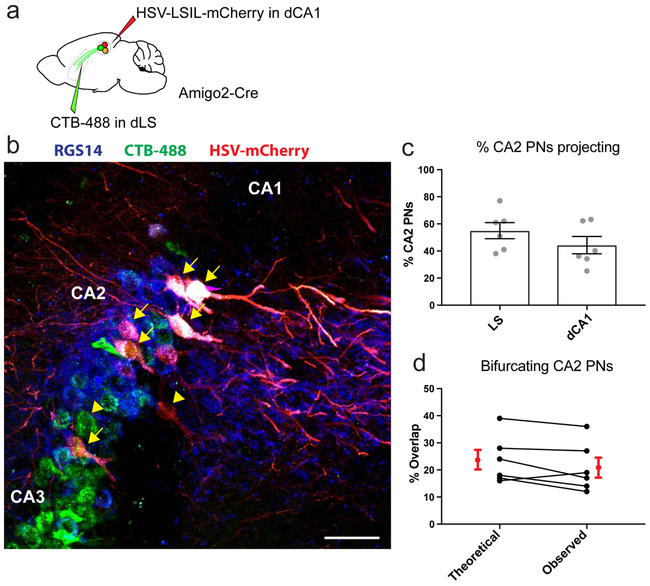
Extended Data Figure 4: CA2 PNs project to both dCA1 and LS.
a. Dual retrograde staining of CA2. Injection of HSV-LSL1-mCherry into dorsal CA1 and CTB-488 into LS of an Amigo2-Cre. b. Hippocampal coronal section following injection in a and labelled for RGS14. Arrowhead denotes single labelled cells and arrows dual-labelled ones. Scale bar 50 μm. c. Quantification of the percentage of CA2 PNs projecting to either dLS or dCA1. Because retrograde labeling efficiency is not complete, the fraction of labeled cells provides a lower limit on the fraction of dCA2 PNs projecting to these regions (12 sections from 6 mice in each group). Bars show mean ± SEM. d. Comparison of the expected percentage of dual labelled CA2 PNs versus the observed percentage. The fraction of dual-labeled cells (21±4%) was almost identical to the fraction predicted under the assumption of random retrograde labeling of a single population of CA2 PNs, each of which sends a projection to CA1 and LS ([fraction of labeled CA1-projecting cells] × [fraction of labeled LS-projecting cells] = 0.55 × 0.44 = 24%). This is similar to results suggesting that a uniform population of CA3 PNs projects to both LS and CA151. Thus, it is likely that a single population of CA2 pyramidal cells projects to both LS and CA1. Two-sided Wilcoxon test, P=0.2. Black dots: individual mice (n=6). Red dots with error bars: mean ± SEM.

