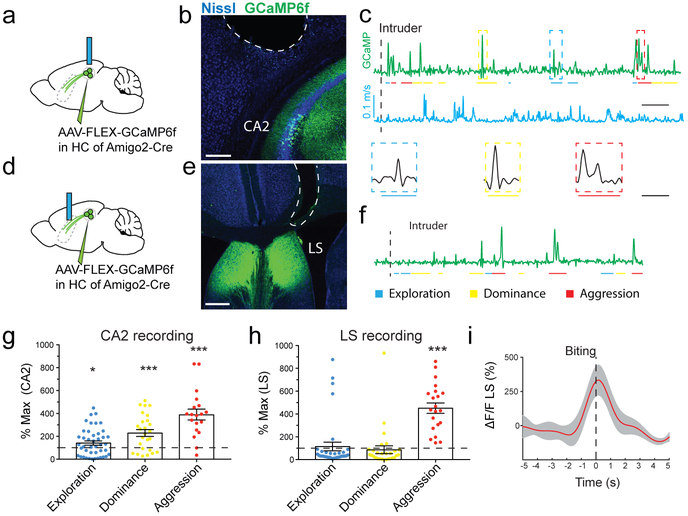
Figure 5: CA2 PNs respond to diverse social encounters whereas CA2 terminals in LS convey selectively aggression-related information.
a. Schematic of fiber-photometry recordings of GCaMP6f fluorescence signals from CA2 PNs in the hippocampus (4 mice). b. Coronal section of the hippocampus showing the expression of GCaMP6f and optical fiber location. c. Example recording of GCaMP6f signal (green) with fiber over CA2 during resident-intruder test. Mouse velocity shown in blue. Colored bars define episodes of social exploration (blue), social dominance (yellow) and biting attack (red). d. Schematic of GCaMP6f recordings with fiber over dLS (5 mice). e. Coronal section of LS showing expression of GCaMP6f and fiber location. f. Example recording of GCaMP6f signals from CA2 PN projections in dLS during resident-intruder test. g. Plot of CA2 peak GCaMP6f signals during behaviors. Each point is from a single behavioral episode (43, 26 and 19 episodes left to right, 5 mice). Bars: mean ± SEM. One-sample two-sided t-tests against baseline (from left to right): *P=0.02, ***P=0.0002, ****P<0.0001. h. Same as g. but recorded from dLS (34, 28 and 21 episodes from left to right, 6 mice), ****P<0.0001. i. Mean GCaMP6f signal (red line: mean, grey area: ± SEM) in dLS aligned to onset of biting and normalized to baseline (21 attack episodes). Scale bars: b 200 μm; e 400 μm; c,f 50s; enlarged episodes in c 10s.

