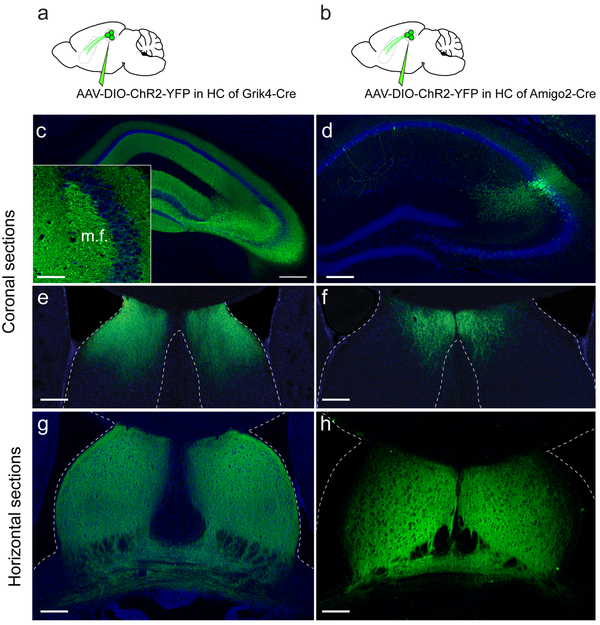
Extended Data Figure 2: CA3 and CA2 project to different but overlapping regions of LS.
rAAV5-EF1a-DIO-hChR2(E123T/T159C)-eYFP was injected into the hippocampal CA3 region of a Grik4-Cre mouse (a) and the CA2 region of an Amigo2-Cre mouse (b). c-f. Hippocampal (c-d) and lateral septum coronal (e-f) sections. g-h. Horizontal LS sections. 3 mice injected per experiment. All mice presented similar staining pattern. All scale bars 200 μm except in the inset (50 μm).

