FIGURE 2.

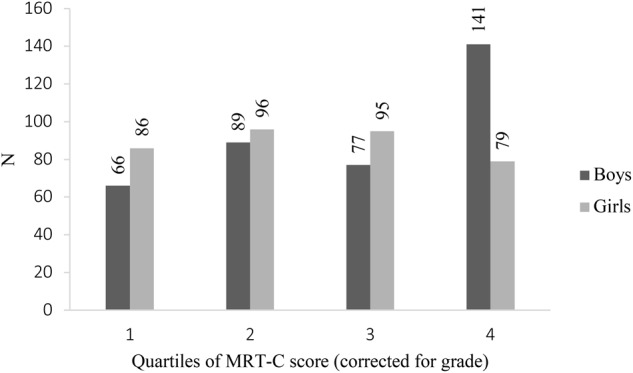
Sex differences in MRT-C performance in the total population divided over quartiles. Quartile 1 = 25% lowest MRT-C scores: quartile 4 = 25% highest MRT-C scores. ∗p-Value ≤ 0.01.

Sex differences in MRT-C performance in the total population divided over quartiles. Quartile 1 = 25% lowest MRT-C scores: quartile 4 = 25% highest MRT-C scores. ∗p-Value ≤ 0.01.