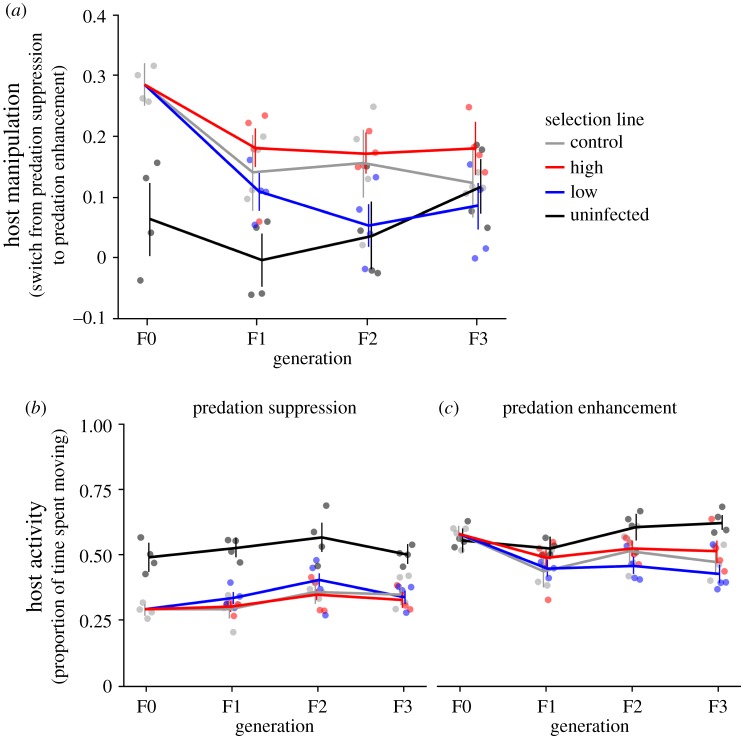
Figure 2.
Host manipulation over generations. (a) Host manipulation. (b) Predation suppression (i.e. days 6–8 post infection, not-yet-infective parasites), (c) Predation enhancement (i.e. days 13–15 post infection, infective parasites). Error bars represent 95% confidence intervals. n: F0: uninfected: 27, infected: 132, F1: uninfected: 47, control: 60, high: 158, low: 149, F2: uninfected: 28, control: 49, high: 144, low: 135, F3: uninfected: 46, control: 65, high: 90, low: 101. Points indicate replicate populations.

