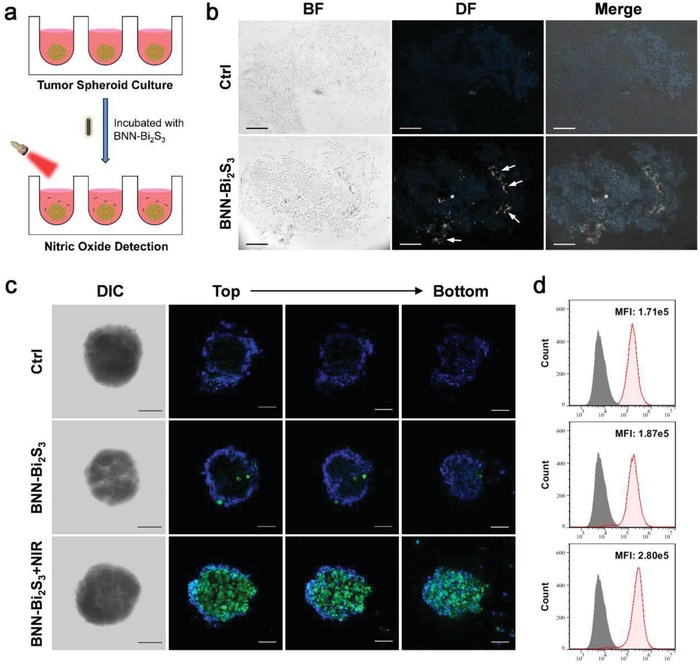
Figure 2.

Evaluation of NO diffusing capacity in MCTS model. a) Schematic illustration of NIR‐stimuli NO release from BNN‐Bi2S3 in 3D tumor spheroid model. b) The bright field and dark field images of the frozen sections of tumor spheroids with or without BNN‐Bi2S3 treatment. Arrows represent dark‐field signal of BNN‐Bi2S3 nanoparticles. The scale bars are 100 µm. c) Confocal images of tumor spheroid with different treatments. The cells were stained with Hoechst 33342 (blue) and DAF‐FM (green). The concentration of BNN‐Bi2S3 nanoparticles is 20 µg mL−1. The irradiation power is 0.5 W cm−2, for 10 min. d) Flow cytometry analysis of BEL‐7402 cells trypsinized from the tumor spheroids in different groups. The shadow curve is the unstained negative control.
