
Figure 5.
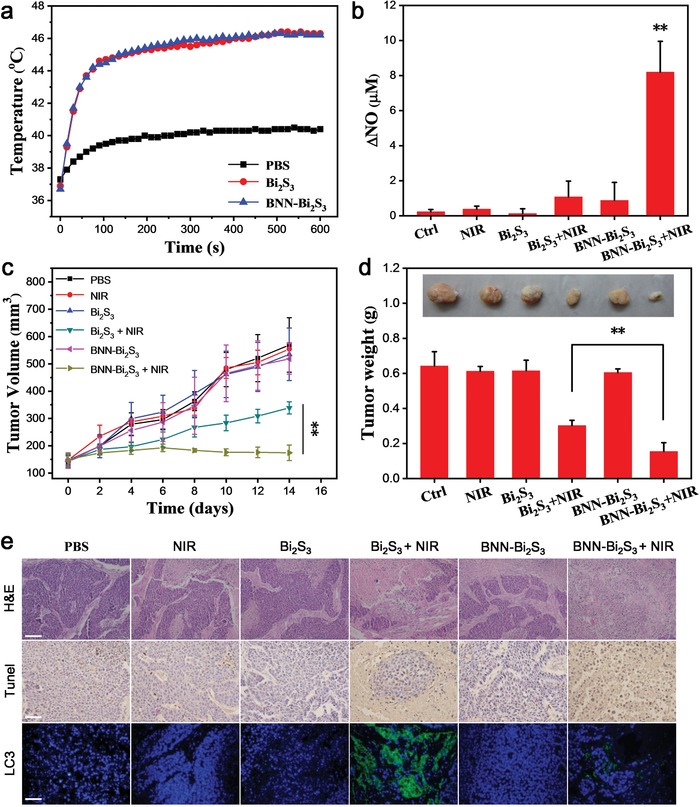
Synergistic antitumor effect of photothermal therapy and NO in vivo. a) The temperature of tumor obtained from thermal infrared imager. b) The changes of NO concentration in each group after treatment. The data are shown as mean value and standard deviation, n = 3. c) Tumor volume curves of different groups of mice after various treatments (four mice for each group). d) The average tumor weight in each group. Inset: Photo of the representative tumors collected from different groups at the end of treatment. e) Pathological features of tumor tissues in representative mice. Tumor tissues were H&E stained (top), TUNEL stained (middle), and LC3‐II antibody Stained (bottom); the entire nucleus was stained with Hoechst 33342. All the scale bars are 100 µm. p values in (b),(c) were calculated by Student's t‐test (** p < 0.01).