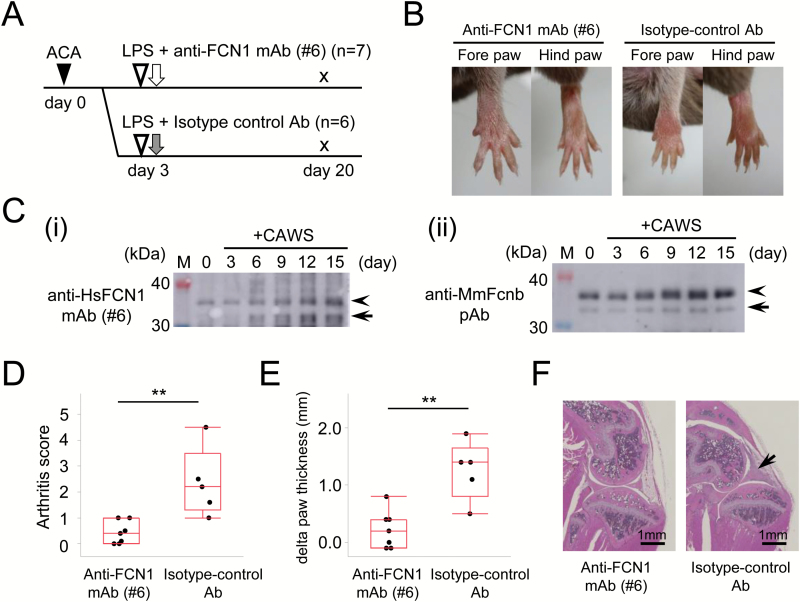
Fig. 4.
Treatment of CAIA mouse, a model of RA, with anti-FCN1 mAb. (A) Experimental protocol. Black triangle indicates intra-peritoneal injection of anti-type II collagen antibody cocktail (1.5 mg, day 0). White triangles indicate lipopolysaccharide (LPS) administration (50 µg). White arrow indicates anti-FCN1 mAb administration, and gray arrow indicates isotype-control antibody administration, both by intra-peritoneal injection (200 µg, day 3, respectively). Mice were sacrificed on day 20. (B) Representative appearances of limbs of mice treated with anti-FCN1 mAb (left panels) or isotype-control antibody (right panels). (C) Western blotting with anti-HsFCN1 mAb#6 (i) or anti-MmFcnb pAb (ii) of equal amounts of mouse serum before (0 day) or after (3, 6, 9, 12 and 15 days) treatment with CAIA to detect a band for MmFcnb (arrowheads). Arrows denote the putative bands for degradation products of MmFcnb protein. M: lane for size marker. (D) Comparison of arthritis score. (E) Comparison of the change from baseline in total paw thickness of four limbs. The differences were examined by the Wilcoxon rank-sum test. (F) Representative histological images of the knee joint in mice treated with the anti-FCN1 mAb (left panel) or isotype-control antibody (right panel). Arrow indicates cellular infiltration and swelling of the synovium. Scale bar, 1 mm. ACA: anti-collagen antibody cocktail; HsFCN1: Homo sapiens (human) FCN1; MmFcnb: Mus Musculus (mouse) ficolin-b; **P < 0.01.

