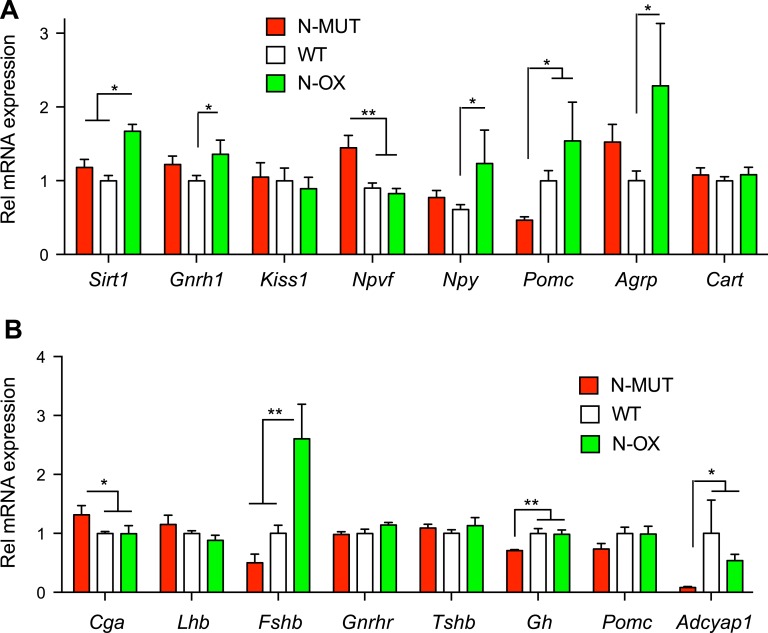
Figure 6.
Hypothalamic and pituitary gene expression in N-MUT and N-OX mice. Data for N-MUT mice are shown in red, in white for WT littermates, and green for N-OX mice in green. (A) Gene expression in the hypothalami from female mice, determined by qPCR. (B) Gene expression in the pituitaries from female mice, determined by qPCR. Data are reported as mean ± SEM; n = 5 for N-MUT; n = 10 for WT, and n = 5 for N-OX. *P < 0.05, **P < 0.01. Rel, relative.

