
Figure 4.
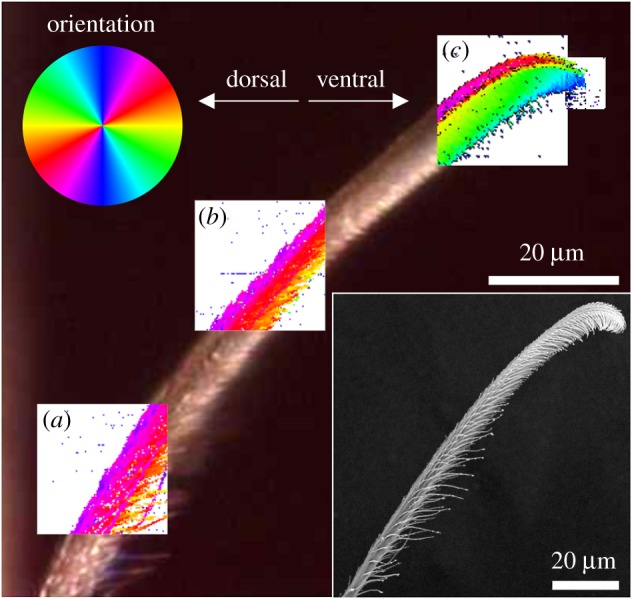
Maps of orientation of mesoscopic structures (sized ∼100 nm) based on the SAXS signal's main orientation in different regions of the attachment seta. The angle of the mesoscopic structures corresponds to the orientation of the colours of the colour circle. (a) Hair shaft, (b) transition zone, (c) tip region. The background image for the overlaid maps is an optical micrograph of the actual position of the seta in the experimental set-up. The inset shows a scanning electron micrograph of the seta long after the X-ray experiments. In the living spider, a substrate surface to attach to would be oriented vertically on the right side of the images. (Online version in colour.)