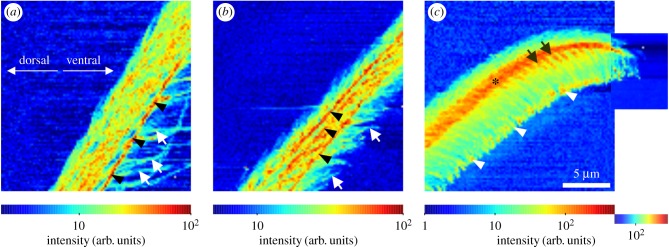
Figure 5.
Small-angle X-ray scattering intensity maps. (a) Shaft region, (b) transition zone, (c) tip region, as shown in figure 4. In each map, the intensity range was adjusted for the maximum contrast as indicated by the colour bars. The arrows in (a) point to clearly visible single microtrichs, and the arrowheads to a line with increased intensity at the edge of the bulk hair shaft. In the transition zone (b), the arrows indicate single microtrichs. Arrowheads point to several lines with increased intensity oriented along the hair's long axis. In the tip region (c), the most intense scattering signal was measured in a backbone-like structure (asterisk), from which the rows of microtrichs branch off (arrows). Arrowheads point to the intense scattering in the spatula region of the microtrichs. (Online version in colour.)

