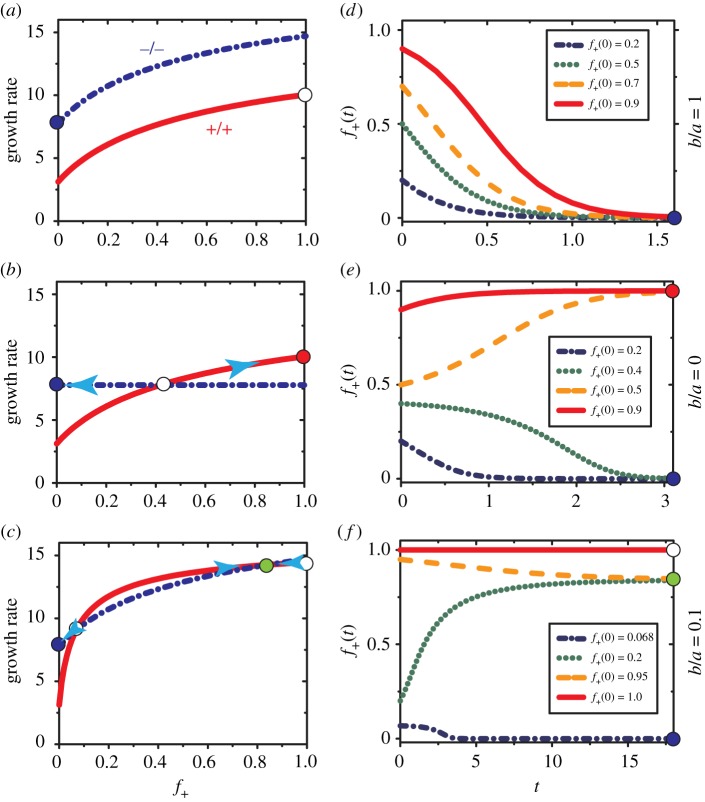
Figure 2.
(a)–(c) Growth rates of +/+ and −/− cells as a function of the fraction (f+) of +/+ cells under different allocation of IGF-II produced by the +/+ cells. (a) Equal share of IGF-II (b = a = 8), (b) no share (b = 0 and a = 8), (c) a small portion (b = 8 and a = 80) is allocated to −/− cells. The value of c0 = 1 and p0 = 4.65 in equation (3.6) are derived from fitting the equilibrium fractions of +/+ cells observed in experiments using our model. The growth rate of +/+ cells are shown in solid red lines while dash-dotted blue lines describe the growth rate of −/− cells. The filled and empty circles indicate a stable or unstable fixed point, respectively. A stable state consisting of only +/+(−/−) cells is indicated in red (blue) colour. The filled green circle shows a stable heterogeneous state representing coexistence of the two cell types. (d–f): The evolution of f+(t) at different f+(t = 0) values corresponding to the allocation strategies of IGF-II in (a–c). Each row represents results from one of the three allocation strategies. The growth rate is defined as the relative density change of cells during the log phase [35]. The unit for time is days.

