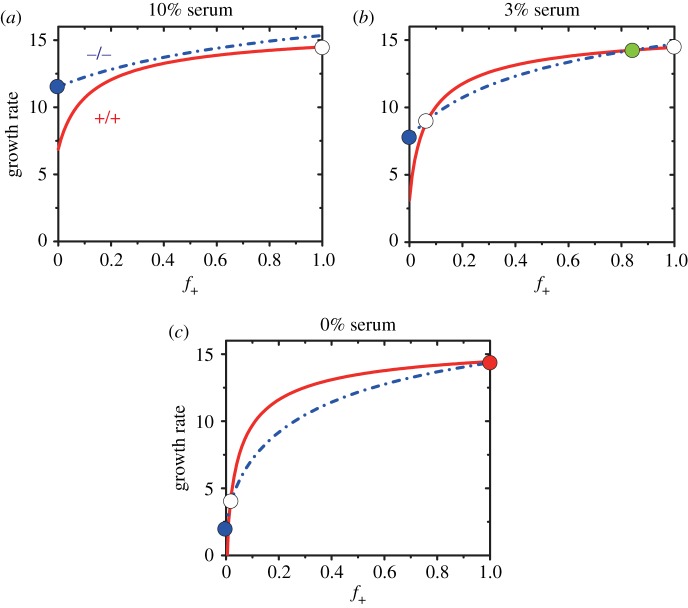
Figure 3.
Growth rates of +/+ and −/− cells as a function of the fraction (f+) of +/+ cells at different levels of exogenous resources (serum). (a) c0 = 3.3 corresponds to serum in experiments; (b) c0 = 1 represents serum; (c) c0 = 0 implies the absence of serum. The value of a = 80, b = 8 and p0 = 4.65, corresponding to the parameters in figure 2c. The flow diagram in figure 3b corresponds to figure 2c. The meaning of the symbols used and the definition of growth rate are the same as in figure 2.

