Figure 4.

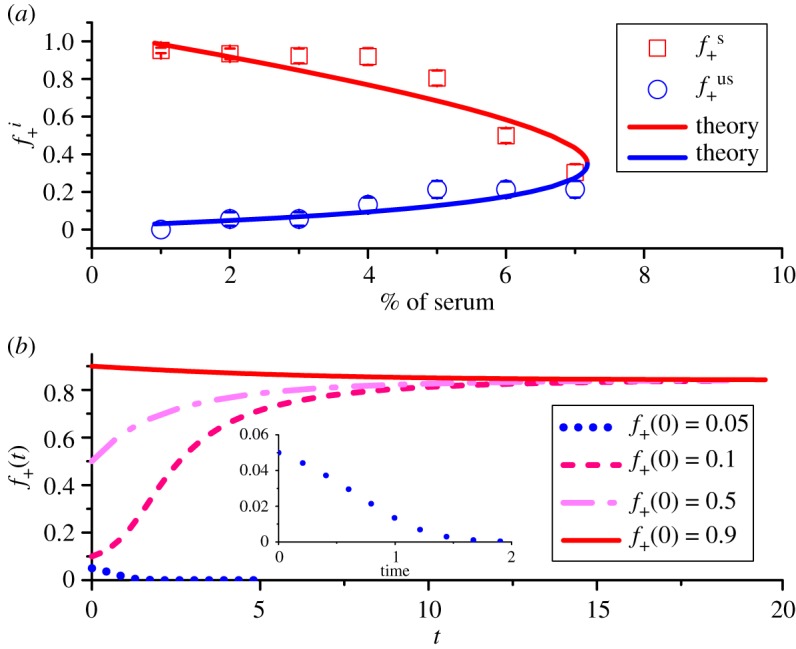
(a) The internal equilibrium fractions (, i ≡ s or us, with s for stable and us for unstable state) of +/+ cells as a function of serum levels. Stable states are shown by red squares while blue circles indicate unstable states. The upper and lower bounds represent the upper and lower boundaries for the equilibrium fractions observed in experiments and the symbols give the middle value of these two boundaries. The solid lines correspond to theoretical predictions using a = 80, and p0 = 4.65 in equations (3.6) and (3.7). (b) Theoretical predictions for the time-dependent changes in the fraction f+(t) of +/+ cells for various initial conditions (f+(0)=0.05, 0.1, 0.5, 0.9) in the presence of of serum. The inset figure shows the evolution of the fraction of +/+ cells with f+(0) = 0.05. The unit for time is days.
