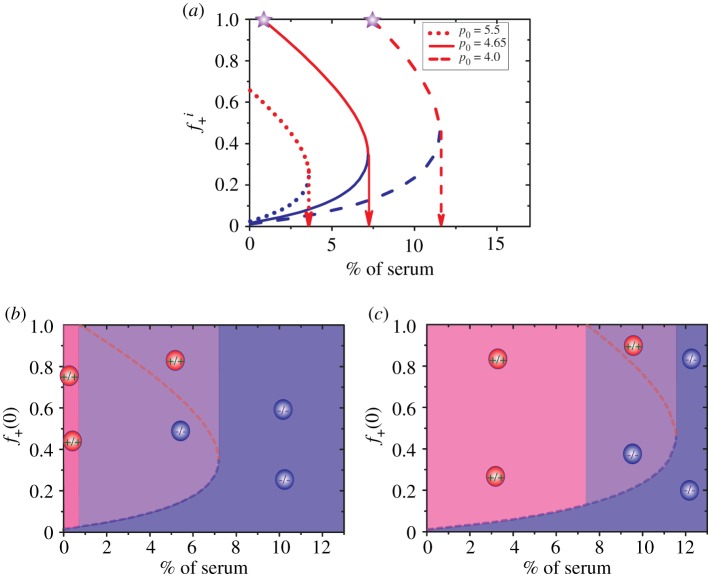
Figure 5.
(a) The internal equilibrium fractions (, i ≡ s, us) of producers as a function of the levels of serum for different p0 values. The fraction () at stable equilibrium is shown in red colour while blue colour indicates unstable equilibrium fractions (). Arrows give the critical level of serum above which only non-producers exist. Purple stars represent the lowest level of serum at which producers and non-producers coexist in a stable equilibrium state. (b,c) Phase diagrams (initial fraction f+(0) versus % of serum) with p0= 4.65 and p0=4.00, respectively. Three stable phases are shown in these two figures. (i) A homogeneous phase consisting of only producers (pink colour). (ii) A heterogeneous phase consisting of both producers and non-producers (purple colour). The stable equilibrium fraction of producers is indicated by the dashed red line. (iii) A homogeneous phase with of only non-producers (blue colour). The red and blue circles represent the producer and non-producer cells, respectively. Remarkably, for both p0 values +/+ and −/− cells coexist in a narrow range of % of serum.

