
Figure 7.
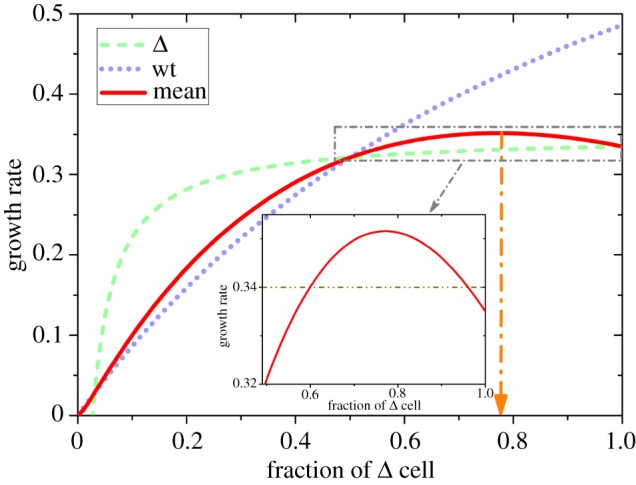
Predictions of the mean growth rate of the GBM tumour cells as a function of the fraction of the Δ cell. The green dashed line gives the growth rate of Δ cells, and the purple dotted line shows the rate of wt cells. The average growth rate of the whole population with both types of cells is given by the solid red line. A maximum is observed at a value f+ ≈ 0.77 (the orange arrow). The inset shows a zoom-in of the dash-dotted line rectangle. The values for the parameters a, b and p0 in this figure are the same as the ones used in figure 6. The unit for growth rate is per day.